Your numbers without Excel exports
What sells, where money leaks and what to prep tomorrow
Reports build themselves from orders, the POS, the kitchen and inventory — no exports or pivot tables. See which items carry the business, where the kitchen slows down, which cashier gives the most discounts and refunds, and how much to prep for tomorrow.
No card required. Paid plans are chosen in the admin — signing up does not start one.
- Sales, average check and top items for any period
- Menu engineering: what to keep, reprice or remove
- A feed of risky POS actions and stock losses between counts

Who it is for
The module is the same — wording and defaults follow your business type.
Restaurant
Menu engineering, kitchen speed by station and a prep plan for tomorrow.
Café and coffee shop
Average check and peak hours, the shift report and what runs out by evening.
Retail shop
Sales by store, stock losses between counts and control of discounts and refunds at the till.
Salon and barbershop
Bookings and sales on your own dashboard, the cash shift report and discount control.
What analytics shows
Sales and guests
- Sales summary
Revenue, order count, average check and the trend for a period; top items by revenue and by quantity.
- Storefront traffic
Sessions, sources and devices, an hourly heat map and the “menu opened → order placed” funnel.
- Custom dashboards
Charts from orders, bookings and appointments, inventory costs, calls and campaigns — up to eight series per chart.
Menu and kitchen
- Menu engineering
Stars, plowhorses, puzzles and dogs by margin and popularity within each category — with a recommendation and CSV export.
- Margin by sales channel
Revenue, the channel’s commission at your rates and margin after food cost — for each channel.
- Kitchen speed
Time to accept and to cook, share of late tickets, the slowest dishes and items voided after cooking started.
Cash and losses
- X and Z shift reports
A mid-shift snapshot and shift close with a cash count: how much should be in the drawer and how much is there.
- Risky actions feed beta
Voids, cancellations, refunds, manual discounts, no-sale drawer opens and receipt reprints — with the cashier and the amount.
- Loss control rules beta
Void series, discount sprees, cash discrepancies and purchase price spikes — a short “look at this” list and, if you want, an email to the owner.
- Stock losses
Between two stock counts, usage splits into sales, explained write-offs and unexplained variance.
Forecast and money
- Demand forecast by dish
How much sells on this weekday — the median of eight weeks, no black box; too little data gets an honest “too few”.
- Prep plan by the hour
The forecast explodes through recipes into prep items with the hour they are needed by — and goes to the shift board.
- Runs out by evening
What will run out before closing at today’s pace, plus a purchase draft grouped by supplier.
- Finance next door
Profit and loss, expenses and labor costs live in a separate Finance section.
Step-by-step guides — Help article →
Sales and the overview in Finance
Two real reports for the selected period. Financial figures complement operational reports from the POS, kitchen and inventory.
Sales for the period
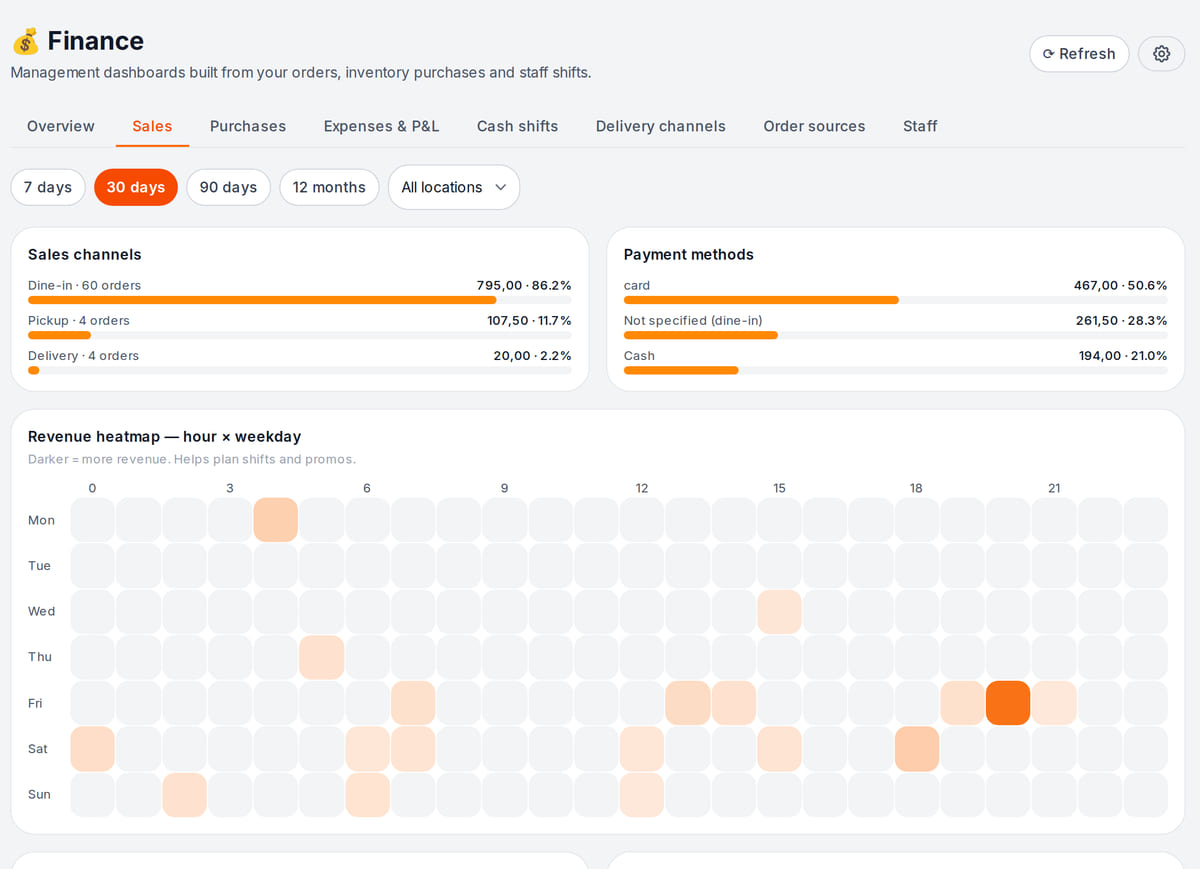
Real screen, test data, 3 October 2026. Revenue by channel, payment method and hour Period overview
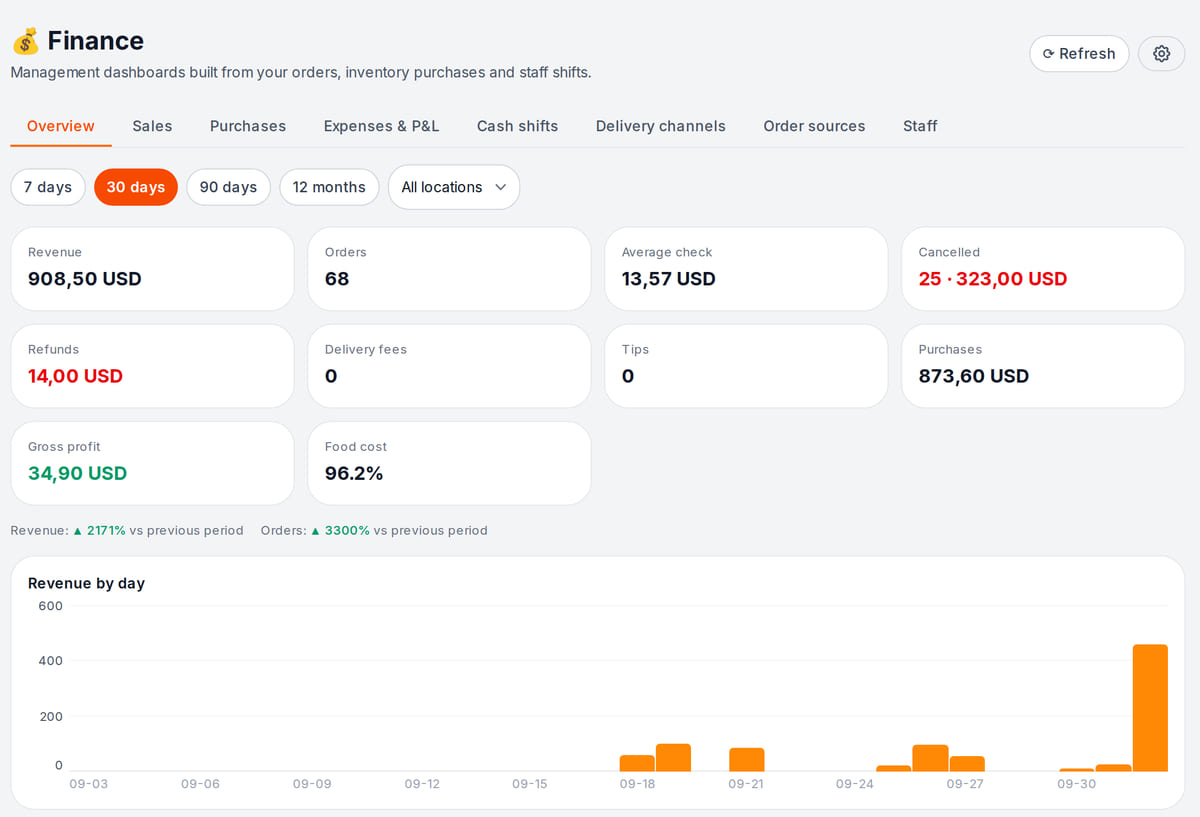
Real screen, test data, 3 October 2026. Revenue, orders and average check alongside the daily trend


Built as one system
Modules share one menu, one order flow and one shift — no exports between programs.
Business finances
Sales, purchases and manual expenses — a simplified P&L with source reconciliation.
Inventory and purchasing
Receipts, movements and physical counts for shops and venues, starting with one item.
POS
A web POS on a tablet or computer: table, bar and counter modes, shifts with X/Z reports, refunds and PIN control.
Kitchen display (KDS)
Tickets by station on a tablet or monitor: statuses, timers, an expo screen and kitchen printing.
Pricing
Available from the plan
Premium
$49 / month
$490 / year when paid annually
Priced per account; the plan sets location, device and order limits.
Good to know
- Basic statistics come with the free plan; advanced analytics and finance dashboards are in the plan below
- Analytics is calculated from your orders, POS and inventory — nothing extra to connect or pay for
- Menu engineering and the forecast need recipes with purchase prices, kept in the Inventory section
Start for free
A free account with one location: build your menu and test the workflow before choosing a plan.
Start for freeHonest limits
- There is no single metrics glossary yet: revenue in statistics, finance and the POS may be counted differently — compare the same periods and slices.
- Numbers are not instant: the analytics databases recalculate on a schedule and when you open the section.
- There is no free-form report builder — you get ready tabs, chart dashboards and CSV exports.
- Menu engineering only covers dishes with a complete food cost; channel commissions are the rates from your settings, not the platforms’ actual deductions.
- The forecast is simple weekday statistics: it does not account for weather, holidays or events.
- The risky actions feed covers the POS only; video clips for them need a camera connected through the bridge and are in beta.
Test your workflow on a free account before buying hardware.
FAQ
Where does the data come from?
From what already happens in Cenaly.com: orders from every channel, cash shifts, kitchen tickets and inventory documents. Nothing to enter separately — reports fill up as you work.
How is analytics different from finance?
Analytics answers operational questions: what sells, where the kitchen slows down, where money leaks, what to prep tomorrow. Profit and loss, expenses and assets live in the Finance section, which has its own page.
Why is menu engineering empty?
The matrix needs a portion cost from recipes with purchase prices. Dishes without a complete food cost stay out of the quadrants — the section says so plainly instead of showing an empty table.
Does the forecast account for weather and holidays?
No. It is the median of the same weekday over eight weeks plus the demand profile within the day. That is deliberate: a small venue has too short a history for “smart” models.
Is the risky actions feed staff surveillance?
It is a log of risky POS actions: discounts, refunds, cancellations. One cashier standing out against the others is visible at once — a reason for a conversation, not an automatic penalty.
Can I build my own report?
You can build your own dashboard from charts on orders, bookings and appointments, inventory costs, calls and campaigns. There is no free-form table builder; menu engineering and lists export to CSV.
How much does it cost?
Basic statistics come with the free plan and advanced analytics with a paid plan — which one and at what price is shown below and on the pricing page.
Step-by-step guides — Help article →
See your menu through the numbers
Create an account, add your menu with recipes and ring up the first sales — reports start filling up on their own.
Talk to us →No card required. Paid plans are chosen in the admin — signing up does not start one.